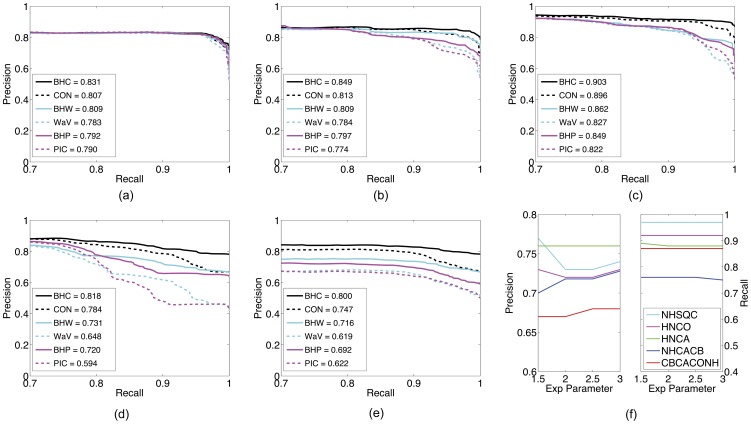
Figure 4. Precision-recall curves for different peak picking methods and sensitivity analysis of B-H WaVPeak.
(a)–(e): precision-recall curves for different methods on 15N-HSQC, HNCO, HNCA, CBCA(CO)NH and NHCACB, respectively. The solid black curves are for B-H consensus method; the dashed black curves are for the 1.5 consensus method; the solid cyan curves are for B-H WaVPeak; the dashed cyan curves are for the original WaVPeak; the solid magenta curves are for B-H PICKY; and the dashed magenta curves are for the original PICKY. The relative area under curve (AUC) values are in legends, which are the area under curve over the total area of recall at least 0.7. (f): sensitivity analysis for different number of peaks. The precision and recall values of B-H WaVPeak are shown when
  ,
,  ,
,  and
and  top peaks are used to calculate the p-values.

