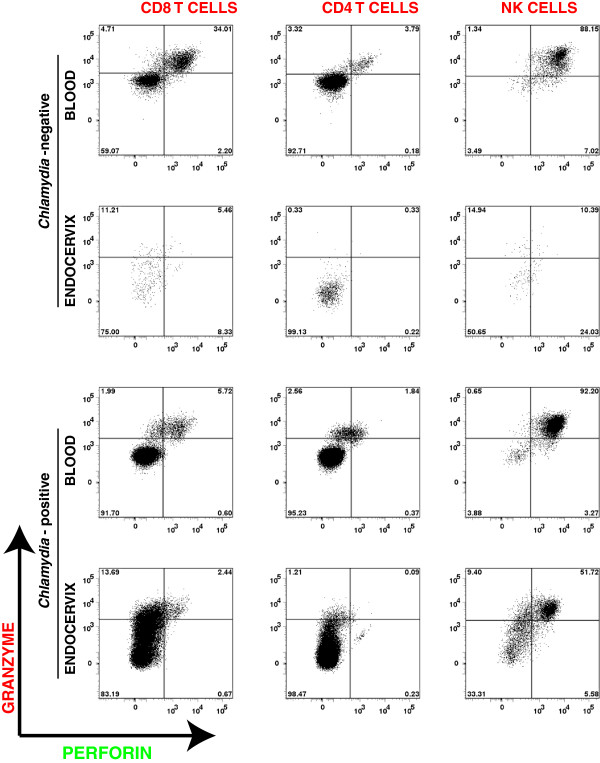
Figure 4.
Relative perforin and granzyme staining of CD8, CD4 T cells and NK cells. Representative dot-plots of perforin and granzyme expression are shown for each immune cell types derived from the blood and endocervix of representative C. trachomatis-negative and C. trachomatis-positive women. The relative expression pattern across blood and endocervix from the same patient demonstrate that the perforin staining is lowest in CD4 T cells and highest in NK cells (CD4 T cells < CD8 T cells < NK cells).

