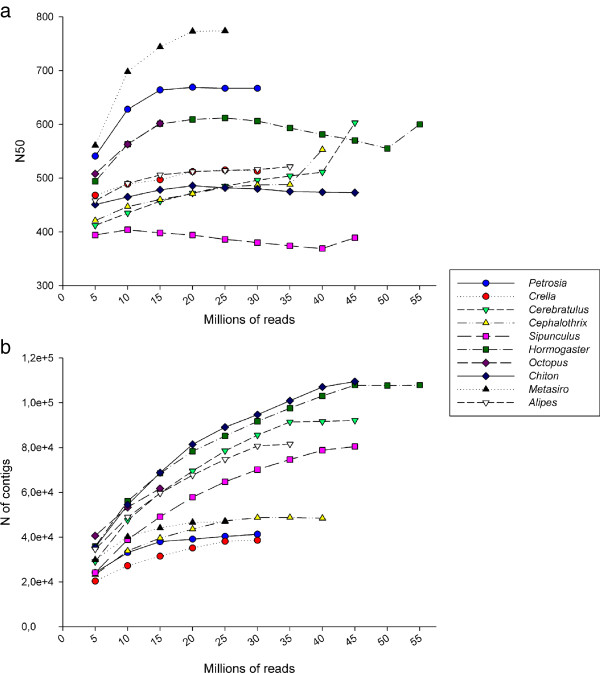
Figure 9.
Assembly of the transcriptome datasets through sequential addition of 5 million reads.a: N50; and b: total number of contigs, were plotted against the different assemblies obtained for each species. Note that the final values in this figure are different from those in Table 2 because we used a newer version of CLC Genomics Workbench (v. 5.1).

