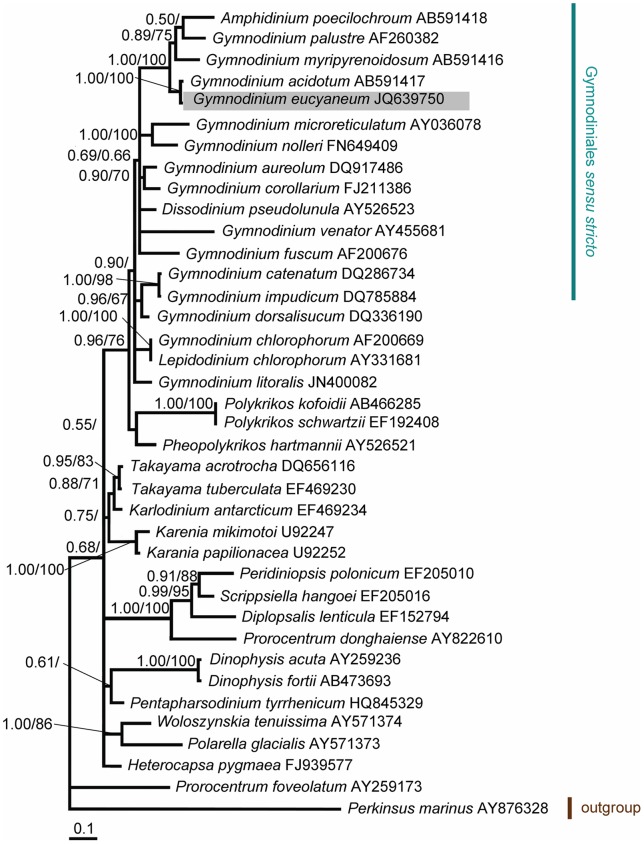
Figure 3. Bayesian phylogenetic tree constructed from the nuclear LSU rDNA sequences.
The numbers on the nodes represent the posterior probabilities (PP)/bootstrap support values (BP) produced by the Bayesian inference and maximum-likelihood analyses. Values >0.50 for PP and >50 for BP are shown. The sequences obtained in our study are shaded in gray.

