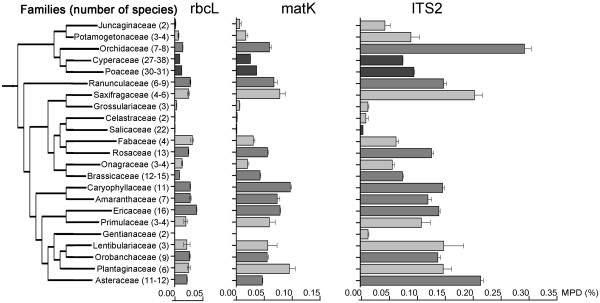
Figure 3.
Within families mean pairwise distance (MPD) analysis for rbc L, mat K, and ITS2. Families with two and more species with available barcodes have been selected. Families are displayed in phylogenetic order, with tree constructed using Phylomatic [72]. The number of species is shown in round brackets next to the family name. In some cases this number slightly varied depending on the available barcodes for three different markers. Light grey: 2-6 species. Grey: 7-16 species. Dark grey: 22-38 species. The bars show means for the pairwise distances (%) between all specimens within the families with available barcodes for the markers rbcL (average 0.02%), matK (average 0.04%), ITS2 (average 0.12%). However, the correlation of MPD values is examined between two chloroplast markers (rbcL and matK), as well as between two chloroplast (rbcL and matK) and a nuclear marker (ITS2). The error bars indicate standard deviations (σ) from mean.

