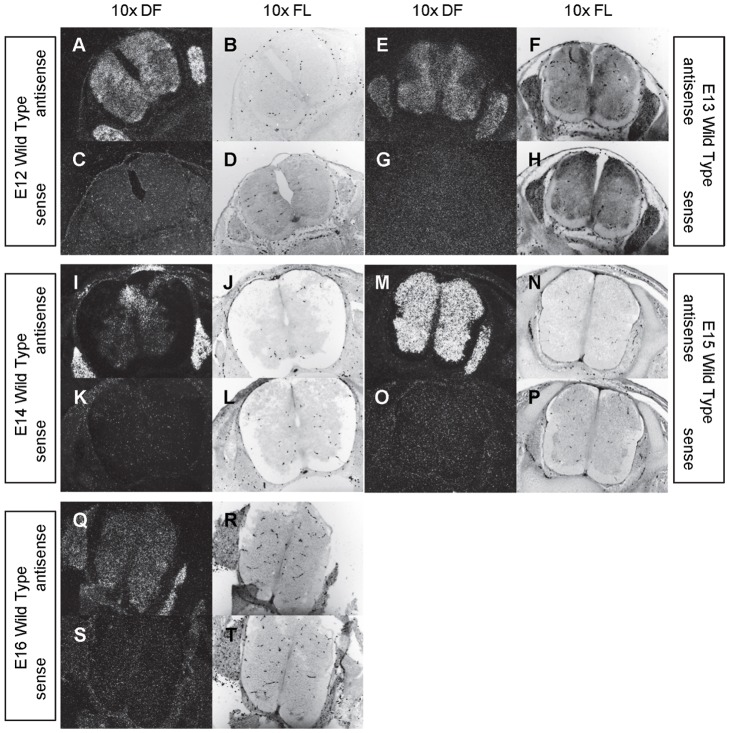
Figure 17. Expression of β-tubulin in the central nervous system of E12 through E16 mice.
In situ hybridization analysis of β-tubulin expression in E12 (A-D), E13 (E-H), E14 (I-L), E15 (M-P), and E16 (Q-T) central nervous system using antisense (A-B, E-F, I-J, M-N, Q-R) and sense (E-D, G-H, K-L, O-P, S–T) riboprobes on transverse sections of wild type (A-T) mice. Sections are shown at 10X dark field (DF; A, C, E, G, I, K, M, O, Q, S) and 10X fluorescence (FL; B, D, F, H, J, L, N, P, R, T).

