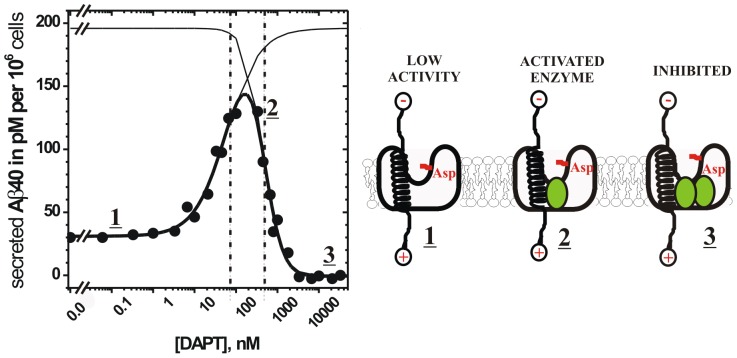
Figure 1. γ-Secretase activity in HeLa cells shows biphasic “activation-inhibition” dose-response curves in the presence of DAPT.
[17] , [18] . Modulation of γ-secretase activity by DAPT was measured by following secretion of Aβ 1–40 from HeLa cells using Aβ 1–40 specific ELISA. The observed biphasic dose-response curves can be described numerically using nonlinear regression and the equation 1 (Table 1). The calculated parameters allow tracing of two binding events, which can be separated mathematically as the activation phase and the inhibition phase (thin lines), with the corresponding EC50 and IC50 values (the vertical dashed lines). Different phases in the biphasic dose-response curve are marked with underlined numbers and the corresponding molecular interactions are illustrated schematically (C99 substrate can be shown as a transmembrane helix [75], while γ-secretase can be shown as a membrane embedded complex with a central aqueous cavity [76]). Complex 1 represents γ-secretase activity on its substrate in the absence of DAPT (31 pM of Aβ 1–40 secreted per 106 cells, Table 1). Complex 2; DAPT can activate γ-secretase activity on C99 substrate only if both DAPT and the substrate bind to γ-secretase simultaneously. Complex 3, complete saturation with DAPT leads to inhibition, indicating that there are at least two different binding events for DAPT, one activating and one inhibiting.

