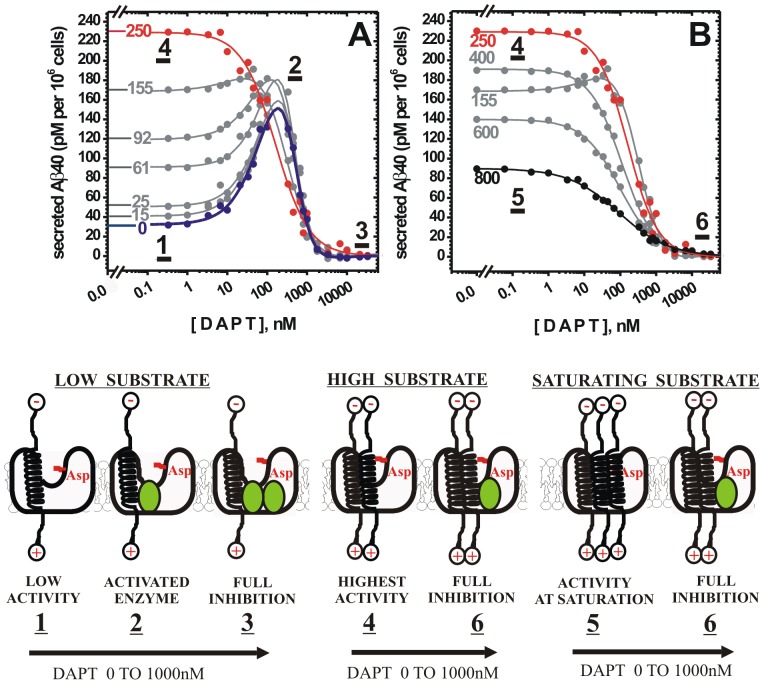
Figure 2. Gradual increase in the extent of γ-secretase saturation with its substrate leads to gradual changes from the biphasic to the standard dose-response curves.
Modulation of γ-secretase activity by DAPT was measured by following Aβ 1–40 secretion from HeLa cells using ELISA. The numbers next to each curve indicate pSG5-cDNAwtC99 in ng/mL, the profile at 0 ng/mL represents activity on the endogenous substrate (i.e. untransfected cells just as in Fig. 1). HeLa cells were transfected with increasing concentrations of pSG5-cDNAwtC99 plasmid to achieve gradual increase in expression of C99 substrate and Aβ 1–40 secretion (see methods). The observed profiles can be described numerically using equations 1 and 2, the best-fit values and the corresponding statistic are given in Table 2. (A) Different phases in the observed dose-response curves are marked by the underlined numbers to illustrate different molecular interactions schematically. The complexes 1, 2, and 3, represent different interactions between γ-secretase and DAPT at sub-saturating substrate as described in figure 1. A gradual increase in cDNAwtC99 results in a gradual increase in the enzyme activity at the lowest DAPT concentrations, and a decrease in the extent of enzyme activation by DAPT (Table 2). Thus, there is a direct competition between DAPT and the substrate for binding at the activation site (i.e. competition between complex 2 and 4). This indicates that there are at least two different binding sites for the substrate: the catalytic site and the site that can antagonize binding of DAPT at the activation sites (complex 4). (B) The peak activity is observed at around 250 ng/mL cDNAwtC99, at which point there is no more activation by DAPT, and only inhibition and standard dose-response curves can be observed (i.e. full transition from complex 1 to 4). Further increase in the substrate (i.e. cDNAwtC99 >250 ng/mL) leads to decrease in Aβ 1–40 secretion (Table 2B), which indicates that the substrate can also bind to the inhibition site (i.e. antagonism between complex 5 and complex 6).

