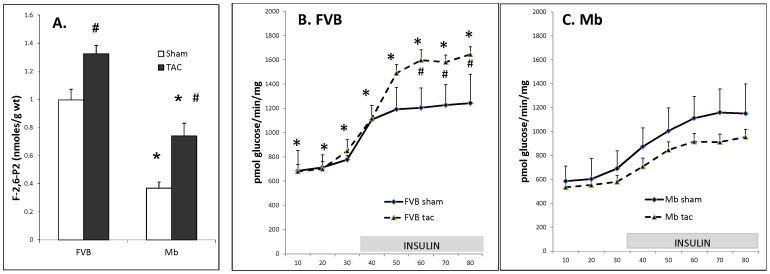
Figure 1. Cardiac F-2,6-P2 content and glycolysis in FVB and Mb hearts 13 weeks after sham or TAC surgery.
Panel A shows that Mb F-2,6-P2 content was reduced relative to FVB under both sham and TAC conditions (* indicates P≤0.05). TAC treatment increased F-2,6-P2 content relative to sham in both groups (# indicates P≤0.05). Panels B and C show that in the presence of insulin TAC increased glycolysis in FVB hearts (# indicates P≤0.05) but did not in Mb hearts. After TAC treatment glycolytic rate was higher at all time points in FVB-TAC hearts (panel B) compared to Mb-TAC hearts (panel C) (* indicates P≤0.05 for FVB-TAC versus Mb-TAC ). Hearts were assayed for F-2,6-P2 content or glycolysis as described in the Methods Section. For F-2,6-P2 content 5 to 8 hearts were used per group. For glycolysis assays 6 FVB-sham, 6 Mb-sham, 9 FVB-TAC and 16 Mb-TAC hearts were measured per group. Data was analyzed by 2-way ANOVA using surgery and mouse type as factors. FVB and Mb glycolysis results are shown on 2 separate graphs for clarity. Axes are the same on both graphs.

