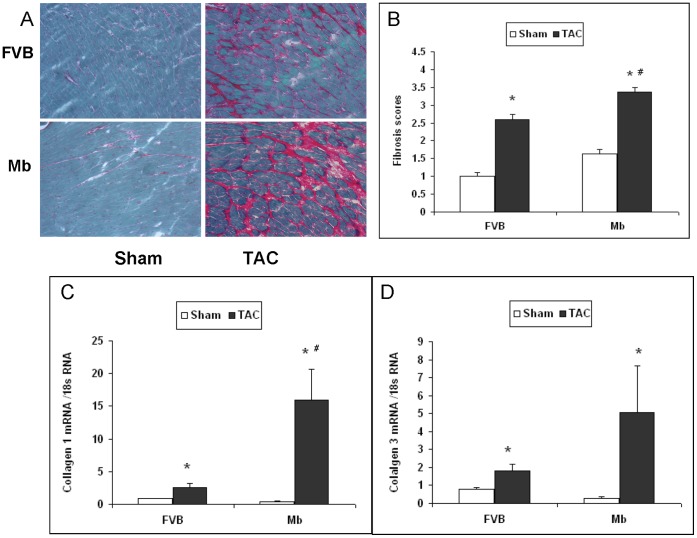
Figure 3. Fibrosis is increased in Mb hearts 13 weeks after TAC.
(A) Representative sirius red staining for fibrosis in FVB and Mb hearts. (B) Semiquantitative scores for fibrosis staining performed as described in Methods by a blind observer. Staining of fibrosis in Mb-TAC hearts was significantly higher than that in FVB-TAC hearts. The expression of collagen 1 mRNA (panel C) measured by quantitative RT-PCR was significantly higher in Mb-TAC hearts than in FVB-TAC hearts. Expression of collagen 3 mRNA (panel D) was elevated in TAC hearts but not significantly different in Mb-TAC versus FVB-TAC hearts. #P<0.05, Mb-TAC vs. FVB-TAC and *P<0.05, Sham vs. TAC by 2-way ANOVA, n = 5 for each group.

