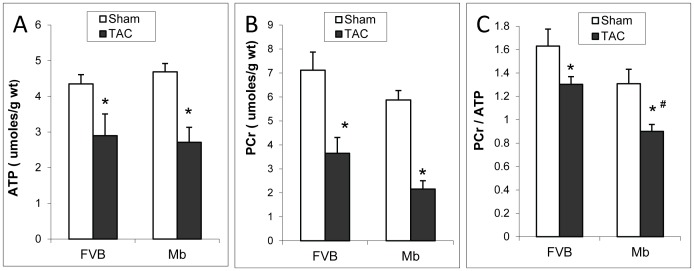
Figure 5. ATP and phosphocreatine in FVB and Mb hearts after TAC or sham surgery.
Panels A–C show ATP, phosphocreatine (PCr) and the ratio of PCr to ATP. TAC decreased the content of ATP (A) and PCr (B), however, the differences between FVB and Mb were not significant. TAC decreased the ratio of PCr to ATP (C) in both FVB and Mb mice, moreover, a significant decrease of the ratio was found in Mb-TAC comparing to FVB-TAC. Statistical analysis was done by two way ANOVA, * indicates p<0.05, sham vs. TAC; # indicates p<0.05, Mb-TAC vs. FVB-TAC. n = 5 for FVB-sham, Mb-sham and FVB-TAC, n = 8 for Mb-TAC.

