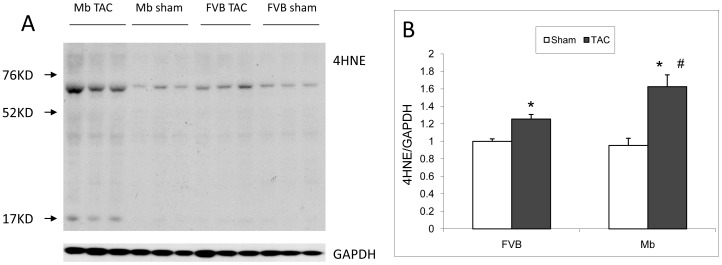
Figure 7. Oxidative stress shown by 4HNE adducts in FVB and Mb hearts.
(A) Representative western blot showing 4HNE adducts and GAPDH loading control. (B) Statistical results of 4HNE adducts normalized by GAPDH. TAC increased the 4HNE adducts in both FVB and Mb hearts. Mb-TAC exhibited more 4HNE adducts than FVB-TAC. * indicates p<0.05 for sham vs. TAC; # indicates p<0.05 for Mb-TAC vs. FVB-TAC by two way ANOVA analysis, n = 6 for each group.

