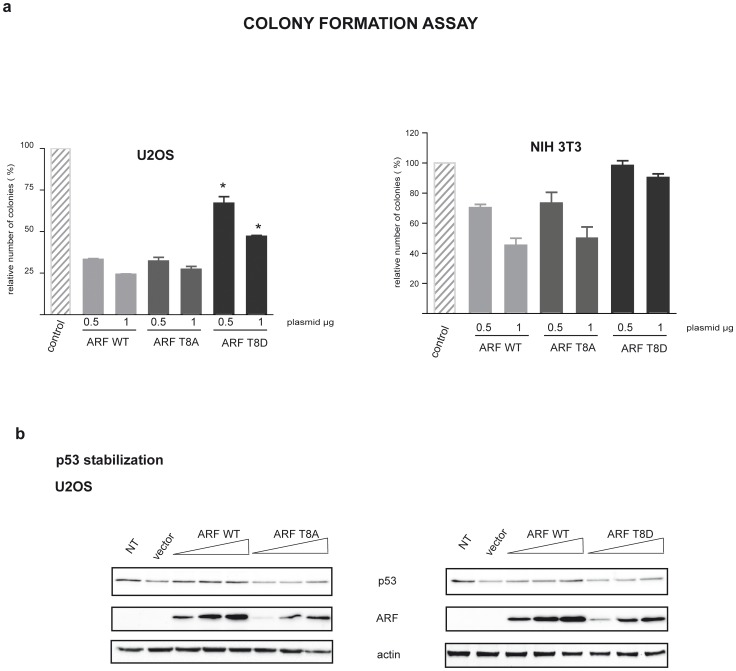
Figure 8. Growth suppression by wt and mutant ARF proteins.
a) Graph indicating ARF and mutants ability to inhibit cell proliferation. U2OS and NIH cells were transfected with the indicated amounts of ARF and mutant expression vectors. After two weeks selection to isolate transfected colonies, cells were fixed and stained with crystal violet. The plot represents the percentage of colonies obtained with the indicated plasmids relative to that detected with the empty vector. Values represent the mean of four independent experiments. Standard deviation for each value is also given. Asterisks (*) indicate statistically significant differences (p<0.001) for the mutant samples compared to wt ARF. b) Western blot showing p53 stabilization following ARF (wt and mutant) transfection in U20S cells.

