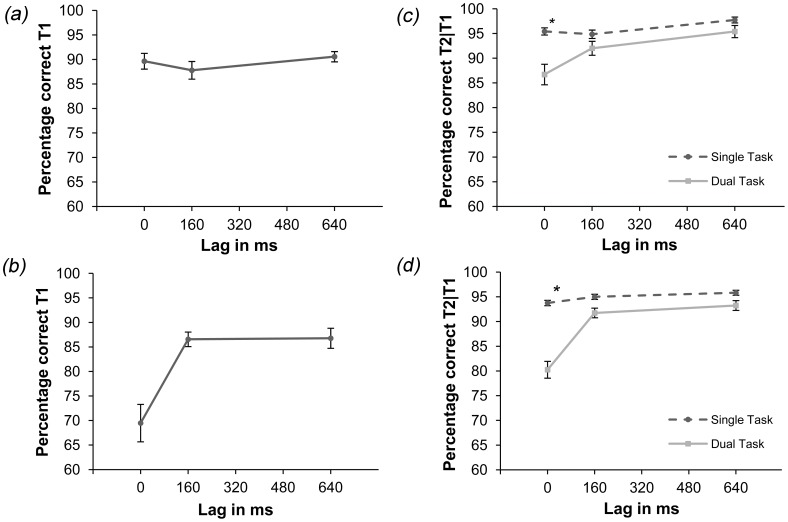
Figure 4. Results of Experiment 3.
Panel (a) Percentage correctly identified letters in the dual-task condition of Experiment 3a. T1-identification was constant over all lags. Panel (b) Percentage correctly identified letters in the dual-task condition of Experiment 3b. Significantly less letters are correctly identified for lag 0 ms compared to lags 160 ms and 640 ms. Panel (c) T2-detection performance in percentage correct in the single- and dual-task conditions of Experiment 3a. Scores for the dual-task condition are for correct letter identification. Performance in the dual-task condition was significantly lower than in the single-task condition at lag 0 ms. Stars mark significant differences between single- and dual-task condition per lag (p<0.05). Note that in this figure chance level is 50%. Panel (d) T2-detection performance in percentage correct in the single- and dual-task conditions of Experiment 3b. Scores for the dual-task condition are for correct letter identification. Performance in the dual-task condition was significantly lower than in the single-task condition at lag 0 ms. Stars mark significant differences between single- and dual-task condition per lag (p<0.05). Note that in this figure chance level is 50%. Error bars reflect 95% confidence intervals in every panel.

