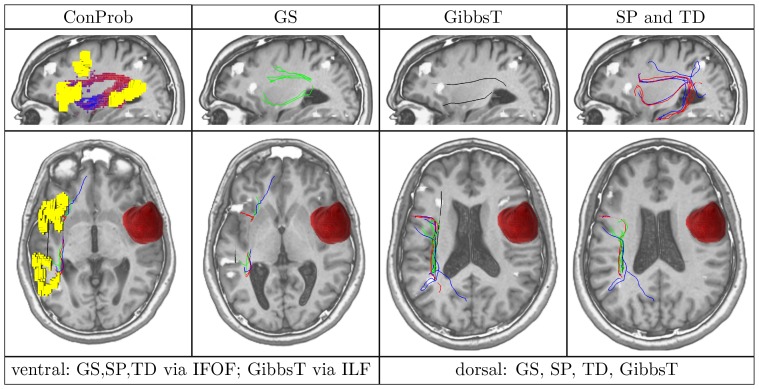
Figure 4. Overview of ConProb, fibers of GS, GibbsT, SP and TD for control patient (male, 36 years) with fronto-lateral anaplastic astrocytoma (WHO grade III) in the right hemisphere.
Upper row (sagittal views): Image 1: Connection probability map (low to high probabilities from blue to red), Images 2–4: dorsal and ventral fibers of GS (green), GibbsT (black), and of SP (blue) and TD (red). Lower row: Axial consecutive images (view from top), two for ventral fibers, and two for dorsal fibers. Tumor segmentations rendered in red. fMRI activations in Broca and Wernicke speech areas (yellow). The following Figures 7 to 10 are arranged in the same way.

