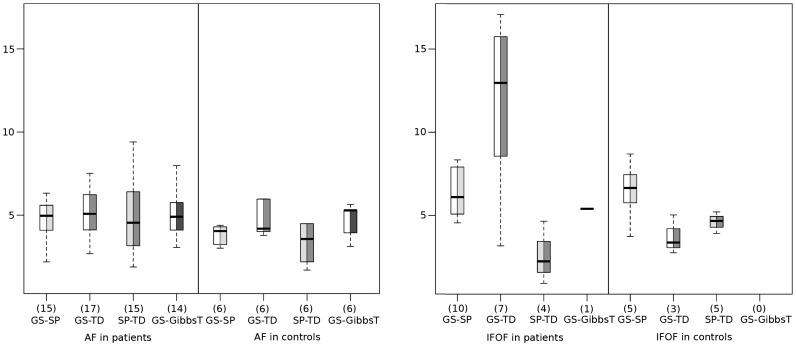
Figure 5. Boxplots showing the average of similarity measure  in mm for the arcuate fasciculus (AF) (left) and the inferior fronto-occipital fasciculus (IFOF) (right) in the patient and control group for each of the compared pairs of methods.
The numbers N of matching fiber tract pairs are provided in parenthesis. These are reduced compared to the numbers of patients (25) and controls (6) as not all of the reconstructed fibers corresponded to anatomical feasible structures.

