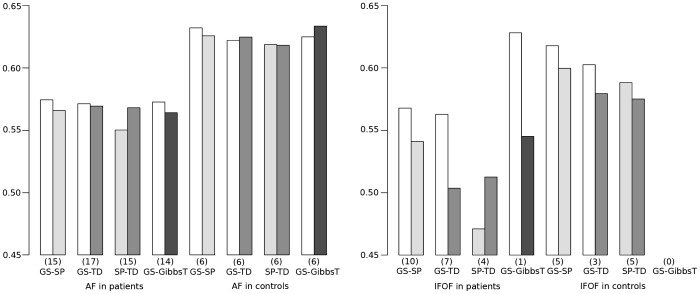
Figure 6. Barplots showing the average fractional anisotropy ( ) of the resulting fiber tracts of each compared pair of methods for the AF (left) and IFOF (right) in the patient and control group.
The numbers N of matching fiber tract pairs are provided in parenthesis. For an explanation of the reduced numbers see Figure 5.

