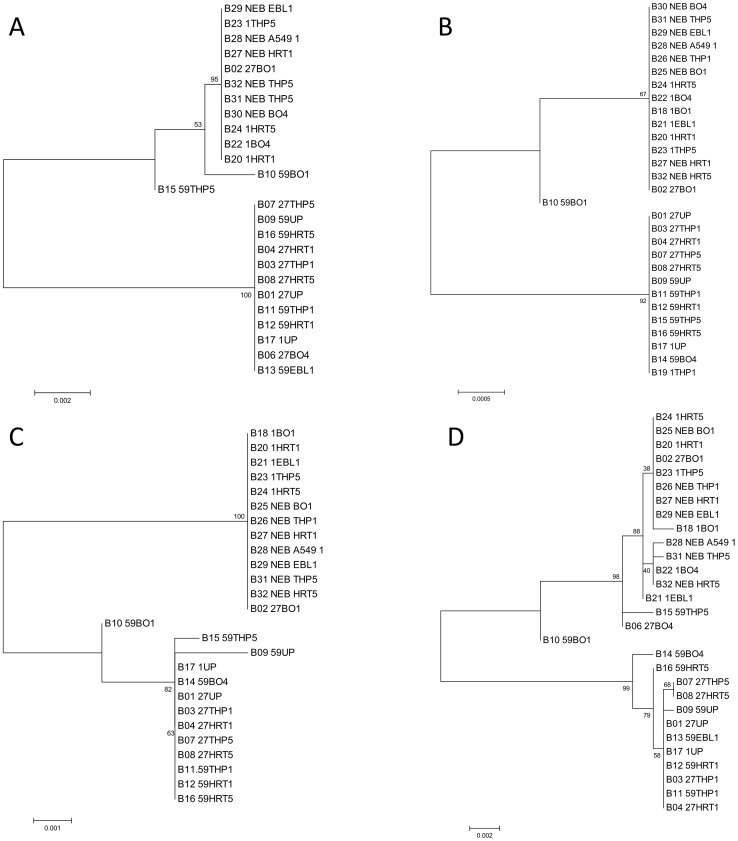
Figure 1. Phylograms generated using consensus sequence for the coding regions of Nsp1, Nsp3, Nsp14, and Spike.
(A–D, respectively.) Samples are labeled using sample sequence identifier (B##), samples #, cell type, and passage number. Phylogeny was inferred by using the Maximum Likelihood method based on the Tamura-Nei model [42]. The tree with the highest log likelihood is shown. The percentage of trees in which the associated taxa clustered together is shown next to the branches. The tree is drawn to scale, with branch lengths measured in the number of substitutions per site. Codon positions included were 1st+2nd+3rd+Noncoding. All positions containing gaps and missing data were eliminated. There were a total of 1671 (nsp1), 851 (nsp3), 1561 (nsp14), and 1457 (spike) positions in the final dataset. The genomic regions included in the analysis span nts 2764–8460 (nsp1), 10858–11714 (nsp3), 17910–19472 (nsp14), and 23641–27732 (spike), as numbered according to accession AB354579. Analyses were conducted using MEGA5 [43]. Samples may be absent from analysis due to inadequate sequence data generated for a particular coding region, however in cases where fewer positions gave the same phylogram as that generated using more positions, fewer positions were used to allow inclusion of more samples in the phylogram.

