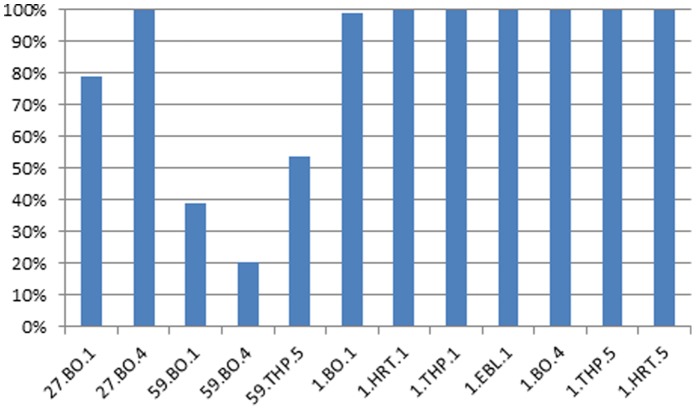
Figure 2. Percent of consensus SNPs that occur as subconsensus variants in unpassaged samples.
The consensus sequence for each unpassaged parent sample was compared to its passaged descendants. For each sample that clustered away from the unpassaged parent (Figure 1), the percentage of passaged consensus SNPs that were present as variants in the unpassaged sample is shown on the y- axis. The x-axis shows the name of the passaged descendant identified by sample (1, 27, or 59), host cell type (BO, THP or HRT) and passage number (1, 4 or 5).

