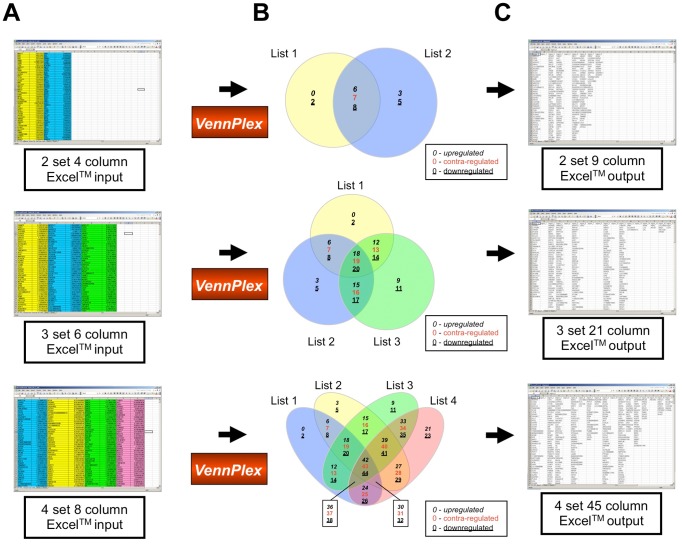
Figure 1. VennPlex data input and output scenarios.
(A) Data input in Excel™ files. Two gene sets and corresponding z-ratios were organized into an Excel™ input file and highlighted in yellow and blue color separately. Three set input data were highlighted in yellow, blue, and green accordingly. Four set input data were highlighted in yellow, blue, green, and red, respectively. (B) Venn diagram drawn by VennPlex program. The numbers in the different sections of 2, 3, 4-set Venn diagram indicate the output set orders in the resultant extracted datasheet in panel (C). To indicate the polarity of numerical regulation of each factor within each set or intersection we have employed a two or three-way key system. The number of factors unique to a set, with a positive regulation polarity are identified with an italic numeral. The number of factors unique to a set, with a negative regulation polarity are identified with an underlined numeral. The number of factors common between multiple sets are indicated with a red colored numeral. This is indicated in a box key for each panel in (B). (C) Data output in Excel™ files.

