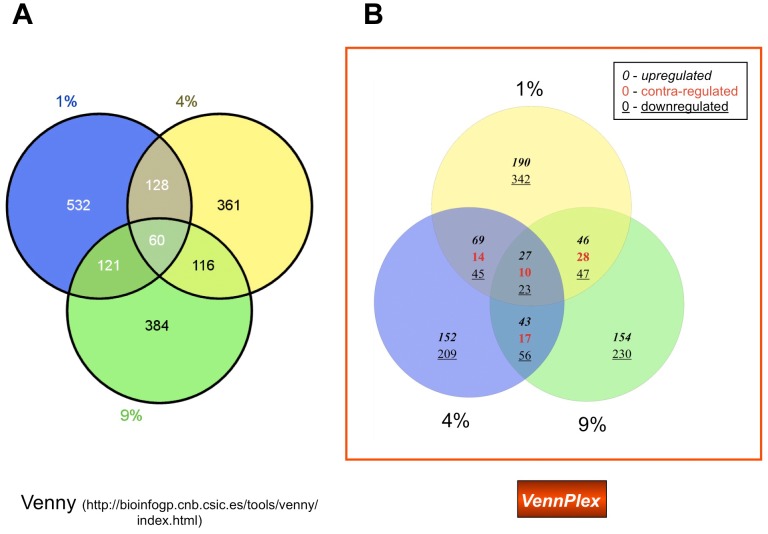
Figure 2. Three-set Venn diagram analysis of multiple oxygen tension-response transcriptional alterations in astrocytes.
(A) 3-set Venn diagram drawn by Venny. 1%, 4%, 9% represent 1%, 4%, 9% O2 conditions, compared to the 20% O2 condition. (B) 3-set Venn diagram generated by VennPlex. The numbers in each section show the number and type (up-, down- or contra-regulated) transcriptional alterations. As stated in Figure 1 the boxed key helps indicate the number of factors in each set or intersection that are upregulated (italic), downregulated (underlined) or contra-regulated (red). For example, there are 60 transcripts common to all three sets, 27 are upregulated (italic) in all three sets, 23 are downregulated (underlined) in all three sets, and 10 (red) demonstrate a mixture of regulation polarities (contra-regulated) between two of the input sets.

