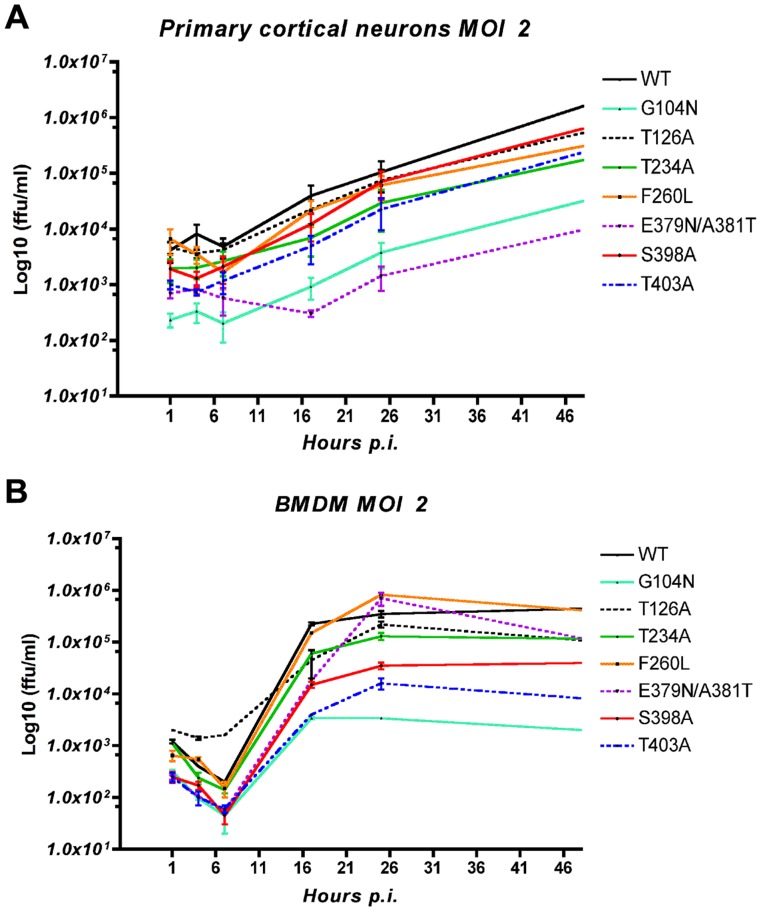
Figure 4. Mouse primary cortical neurons vs. BMDM: rLCMV N-glycan mutants growth curve.
Infection of (A) mouse primary cortical neurons and (B) BMDM were performed at MOI 2. Total virus titer was measured by immune focus assay from cells and supernatant at T1, 4, 7, 17, 24 and 48 h post infection (N = 4).

