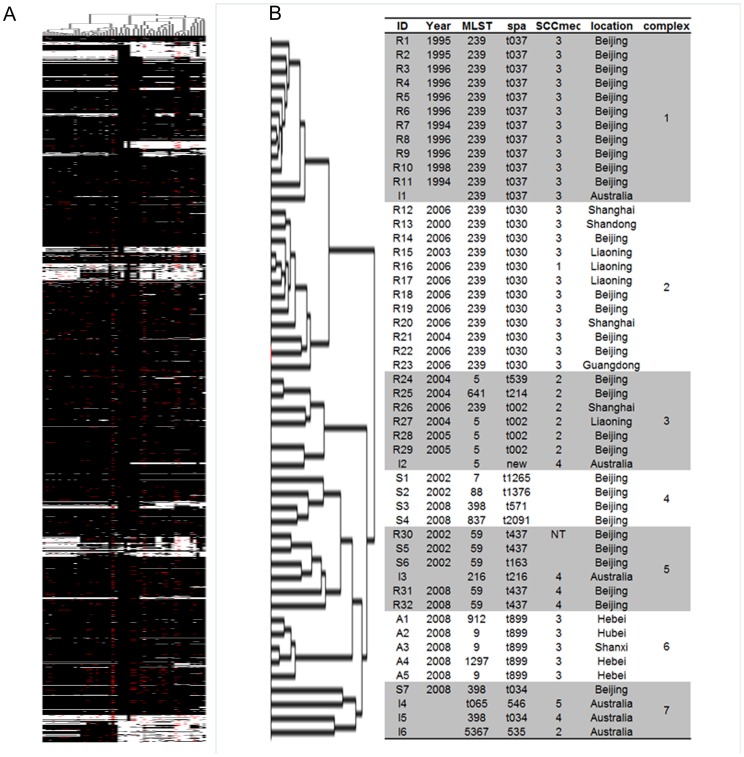
Figure 1. Cluster analysis of 50 strains via microarray.
(A) Phylogenetic tree analysis of 50 strains. White bars: gene absence, black bars: gene presence, red bars: no information. (B) Characteristics of 50 strains. Cluster analysis indicated that all of the 50 strains were clustered into seven different complexes.

