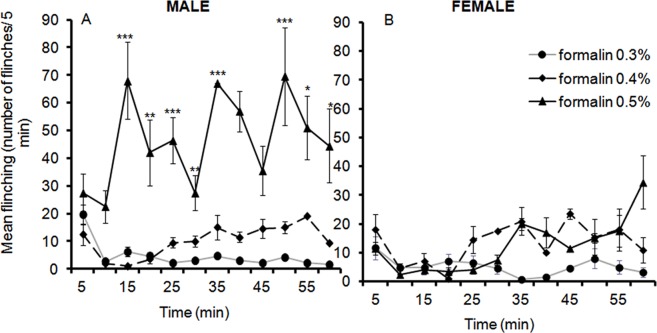
Figure 1. Time course of flinching responses in PND 7 male (A) and female (B) rats in responses to an injection of 0.3%, 0.4%, and 0.5% formalin into the plantar surface of the left hindpaw.
Data are presented as mean +/− SE. * p<.05; **p<.01; *** p<.001, against other groups at the same time point.

