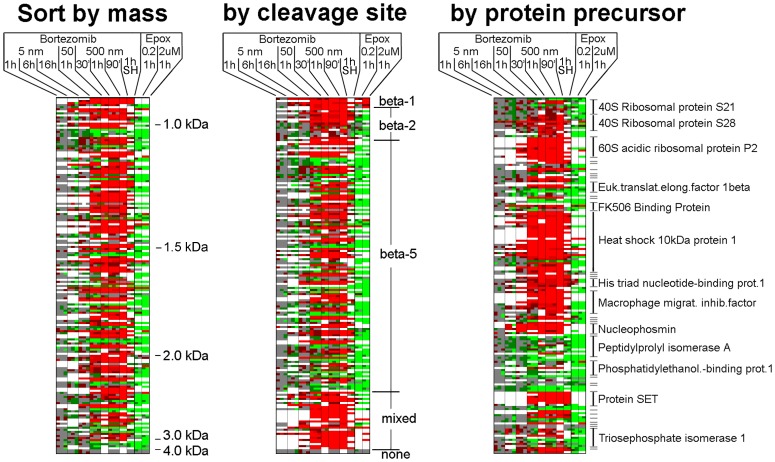
Figure 3. Heat map analysis of selected peptides.
Peptides chosen for this analysis were observed in at least 3 separate experiments. The biological replicates within each experiment are indicated as separate sub-columns, and the color indicates the ratio (using the same color scheme as defined in Figure 2). White panels could not be quantified, either due to undetectable signals or peak overlap with another co-eluting peptide. All data are for HEK293T cells except for the one experiment performed with SH-SY5Y cells (SH). The data from the treatment of HEK293T cells with epoxomicin (either 0.2 or 2 µM) were previously published [29], although these data were reanalyzed to screen for additional peptides identified in the present study with bortezomib. The data used for the heat map are shown in supplemental Table S2, which includes peptide identity, protein name, ratio values, and other information.

