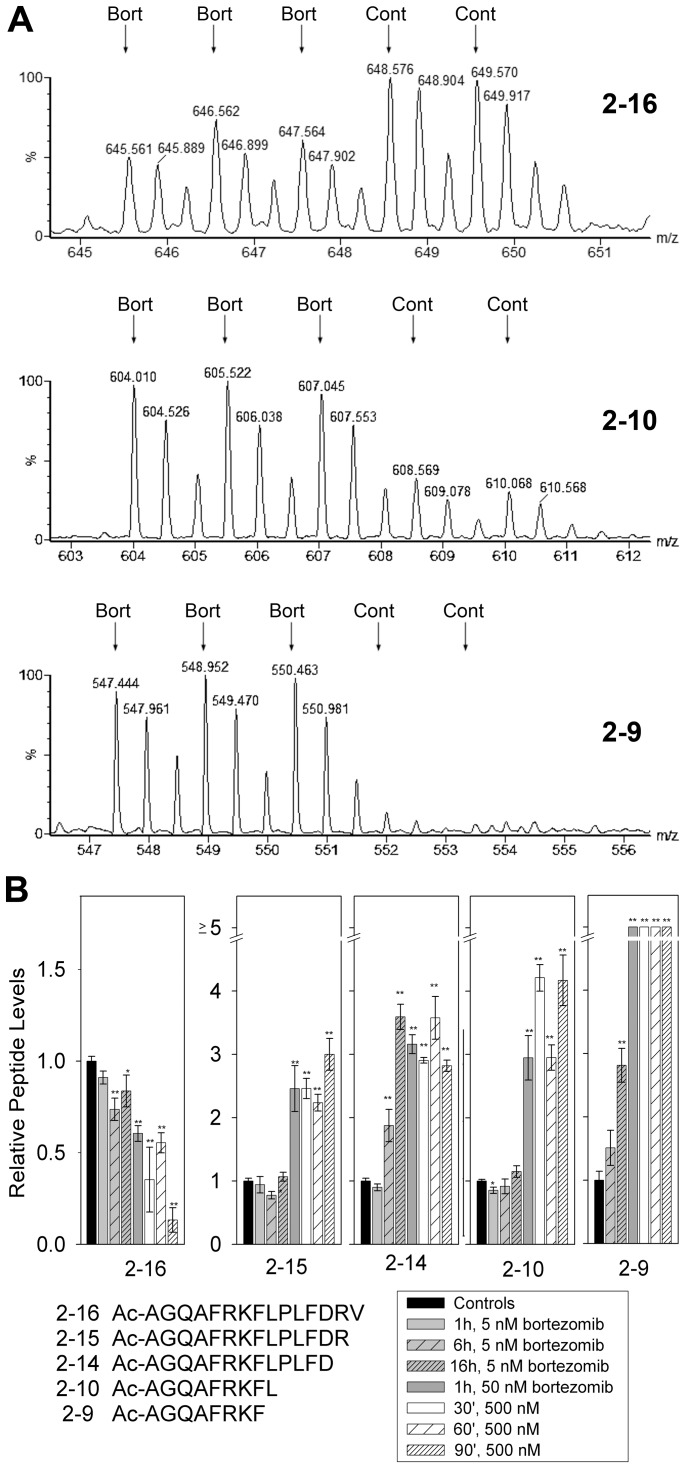
Figure 4. Analysis of the N-terminal fragments of heat shock 10kDa protein 1 (chaperonin 10) upon bortezomib treatment.
A: Representative MS data from the experiment testing HEK293T cells with 500 nM bortezomib for 1 hour. In this experiment the three bortezomib-treated replicates were labeled with D0-, D3-, and D6-TMAB-NHS and the control replicates were labeled with D9- and D12-TMAB-NHS. Mass spectra are shown for the N-terminal fragments representing residues 2–16, 2–10, and 2–9 of heat shock 10kDa protein 1 (chaperonin 10). B: Relative levels of the three peptides shown in Panel A, and of 2 additional peptides in the various experiments. Error bars show standard error of the mean for 2–3 replicates for the bortezomib-treated samples (see Table S1 for original data and number of replicates). For the controls, data from each of the experiments were pooled, resulting in n values of 8–10. *, p<0.05; **, p<0.01 versus control using Student’s t-test.

