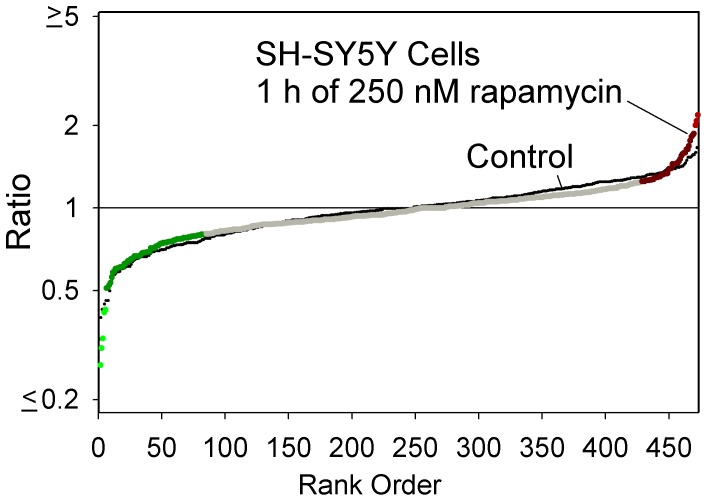
Figure 8. Peptidomics summary of SH-SY5Y cells after induction of autophagy.
Cells were treated with 250 nM rapamycin for 1 hour to induce autophagy and analyzed by the quantitative peptidomics technique. The data are plotted using the approach shown in Figure 2. Large colored circles represent the rapamycin-treated samples, relative to the average control value, while the small black circles represent each individual control replicate compared to the average control value.

