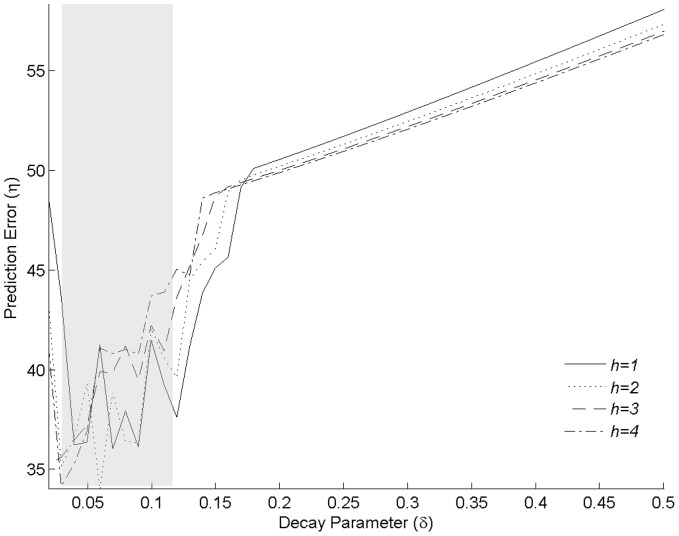
Figure 2. Optimal parameters of the feed-forward neural network.
Variation of the prediction error  as a function of the decay parameter
  and units
  for a single realization of the single layer feed-forward neural network. The shaded area represents the region
  where the prediction error exhibits a prominent decrease.

