
Figure 3. Comparison of the results from FFNN and FD models.

The prediction error  as a function of the number of units
 and optimal decay parameter
 = 0.05 for the FFNN in the presence (S = T) and absence (S = F) of the skip-layer is shown in (a). The prediction error for the FD regression model obtained using the LOO approach is also shown for comparison in (a). The residuals as a function of the predicted values obtained using the LOO approach in the log-scale for the FD model and FFNN
 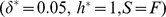 are shown in (b) and (d) respectively. The corresponding scatter plots are shown in (c) and (e) respectively.