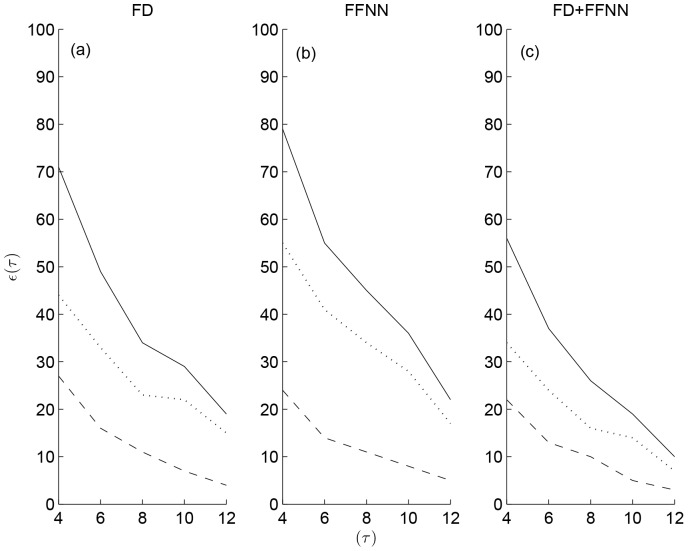
Figure 4. Absolute prediction error across primates and non-primates.
Number of events whose absolute prediction error 
 was greater than a given threshold
 days determined independently using FD and FFNN from their LOO predictions are shown in (a) and (b) respectively. Number of overlapping events (FFNN+FD) across FD (a) as well as FFNN (b) is shown in (c) for comparison. Contributions from primates (dotted lines), non-primates (dashed lines) and all species (solid lines) for each of the cases is also included in (a–c).

