
Figure 3.
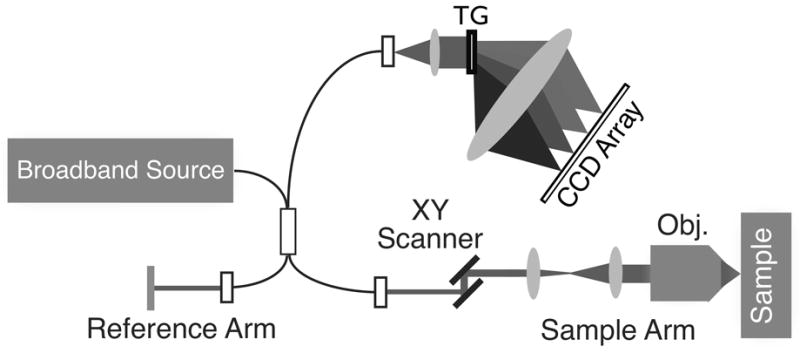
An example SD-OCT system diagram. Light from a broadband source is split into both reference and sample arms using a fiber Michelson interferometer. The returning reflected light from both arms is collected and sent into the interferometer, with the final spectral interferogram recorded using a spectrometer. An XY-scanning system in the sample arm enables raster-scanning over the sample to collect an image volume. TG: transmission grating; Obj.: objective lens. Figure modified with permission from ref. [9].