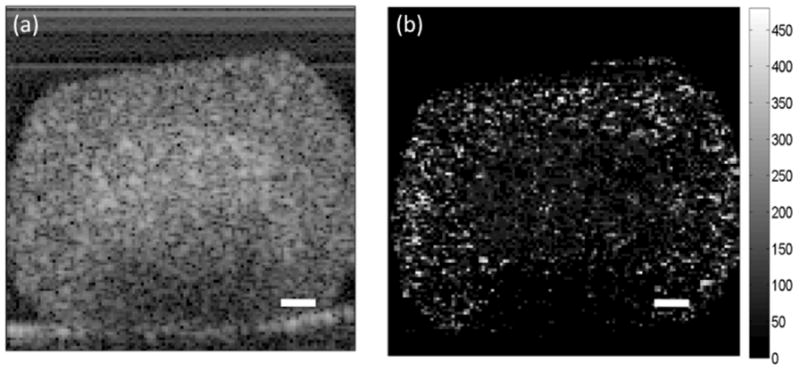
Figure 6.

OCT cross-sectional images of an HT-29 spheroid. (a) Increased backscatter intensity is observed in the core of the spheroid. (b) Parametric image of decorrelation time for the spheroid depicted in (a). Shorter decorrelation times in the core of the spheroid correspond with the regions of higher backscatter intensity. The scale bars represent 100 μm. Reproduced with permission from ref. [145].
