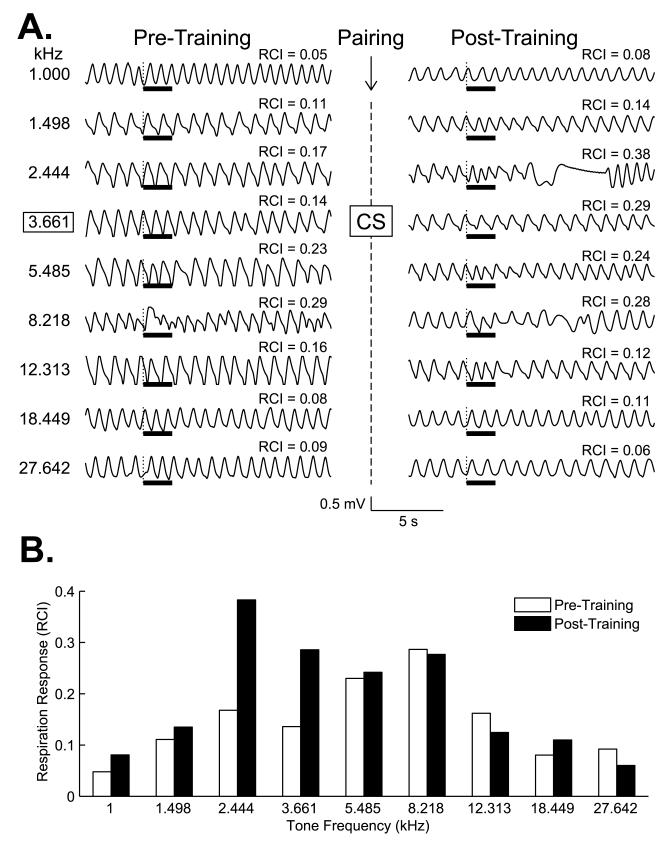
Fig. 4.
Examples of respiration responses for one subject. (A) Sample respiratory waveforms for one trial for each of the nine test tone frequencies. The CS was 3.66 kHz (outlined by frame). Shown are responses on pre-training Day 2 and 24 h post-training. RCI values are the quantified values for each record (within 13-s epoch, as shown in Fig. 3). Note the post-training large disruption of respiration at the CS (3.66 kHz, RCI = 0.29 post-training vs. 0.14 pre-training) and a larger disruption at the adjacent lower frequency of 2.44 kHz post-training (RCI = 0.38 vs. 0.17 pre-training). The thick horizontal bars indicate tone presentation. (B) Plot of RCI values for trials presented above. Note the frequency gradients pre- and post-training. The largest response, and the largest difference between pre- and post-training responses, was not at the CS frequency but at 2.44 kHz.

