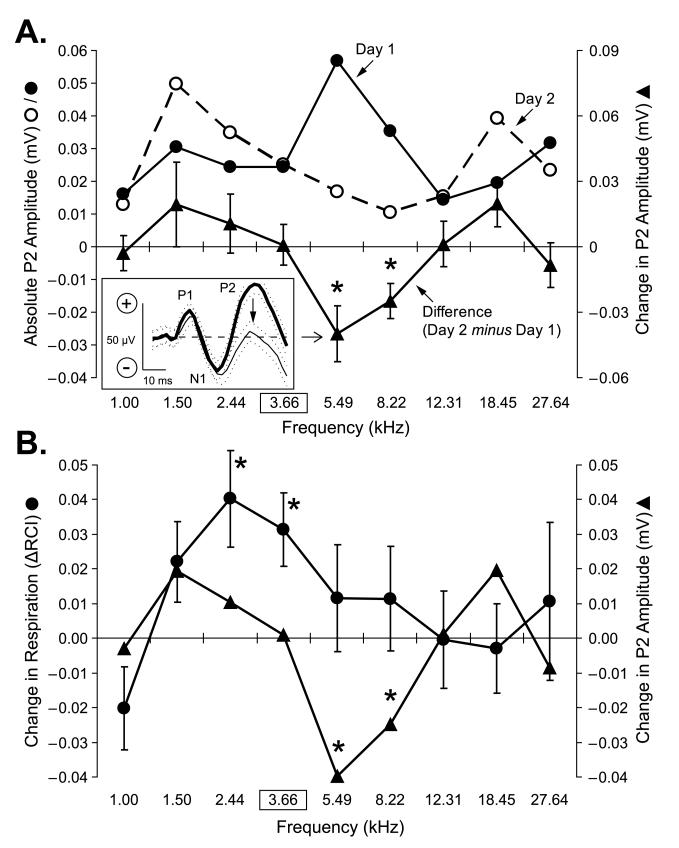
Fig. 6.
Changes in pre-training auditory evoked potentials yield an “inverted” Gabor function. Inset: Group average epidural recorded evoked potential (5.49 kHz) exhibiting P1, N1 and P2 components (see Methods). Note the decrease in the P2 component from Day 1 (thick line) to Day 2 (thin line). Data in figure are for the subset of animals (n = 7) that yielded consistent evoked potentials. (The sequence of different components of evoked potentials [P1, N1 and P2] in this group is the same described in detail previously [Miasnikov et al., 2006].) (A) Dynamics of changes in P2 amplitude of group average evoked potentials for all test tones during pre-training. Day 1 (●): the maximum response was in the middle of the test frequency range at 5.49 kHz. Day 2 (◯): maximum responses were at low (1.50 kHz) and high (18.45 kHz) and the minimum was near the middle of the frequency range (8.22 kHz). The difference between days resembled an “inverted Gabor function” [▴, mean ± se] with the trough falling in the middle of the frequency range and smaller or no decrements, and even some increments, at lower and higher frequencies. The changes showed significant individual decreases in the mid-spectral range, at 5.49 kHz (t(5) = 3.08, p < 0.03) and 8.22 kHz (t(6) = 3.04, p < 0.03). Such response dynamics may suggest that when multiple tone frequencies are repeatedly presented at long inter-stimulus intervals, responses may “habituate” in a non-uniform manner, as if they are the components of one broad-spectrum acoustic stimulus producing maximum habituation at the center of the given spectrum. (Measures of variability were omitted from the response gradients obtained during Day 1 and 2, as they are reflected in the measure of variability shown on the difference function.) (B) Overlay, for ease of comparison, of the peak shifted group ΔFGG (Fig. 5B) and the neural function (Fig. 6A). Left y-axis: change in respiration (ΔFGG); right y-axis: change in P2 amplitude (neural gradient). Note that decremental portion of the neural function is located at 5.49 kHz and 8.22 kHz; both are at frequencies higher than that of the CS (3.66 kHz). This conforms to Spence’s model, which could explain peak shift, at least in part (see text). Statistically significant paired comparisons (Univariate tests) are indicated by asterisks.

