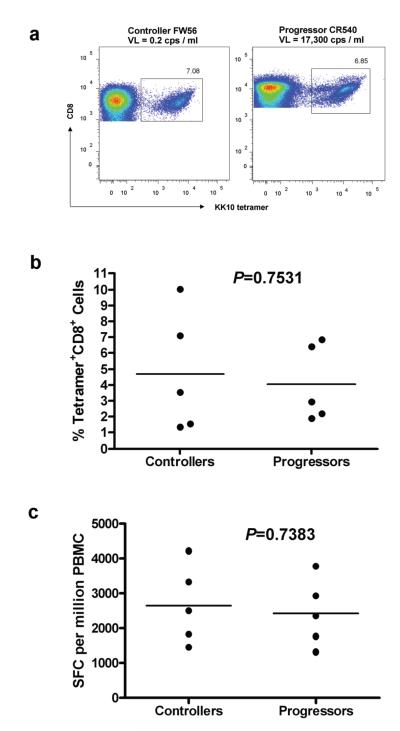
Fig. 1. Quantification of KK10-specific CD8+ T cell responses.
(a) Scatterplot of the percentage of HLA-B*27-KK10-specific CD8+ T cells in a controller (FW56) and a progressor (CR540) determined by flow cytometry and staining with HLA class I tetramers. (b) No significant difference between the controllers (n = 5) and progressors (n = 5) in terms of the percentage of KK10 tetramer-positive cells in bulk CD8+ T cells. (c) KK10-specific CD8+ T cell responses in PBMC were assessed directly ex vivo in an IFN-γ ELISPOT assay following KK10 peptide stimulation. There were no significant differences in response magnitude (calculated as spot forming cells (SFC) per million PBMC) between the controllers (n = 5) and progressors (n = 5). Statistical comparisons were made using the Mann-Whitney test.

