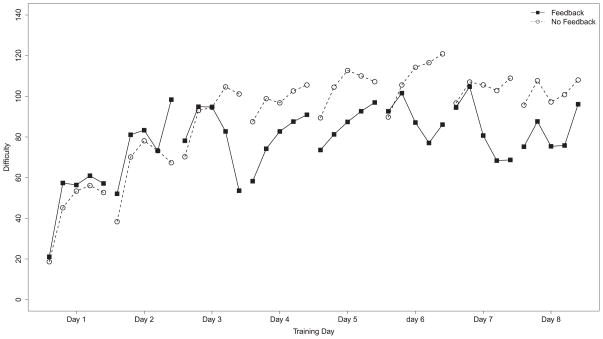
Figure 4.
Level of difficulty for participants trained either with or without feedback as a function of training day. The y-axis is an indicator of difficulty: contexts where it is more difficult for native Japanese (NJ) listeners to differentiate high and low F3 onset frequencies are further from the origin. The portion of the axis marked “Amplitude” refers to those stimuli where non-F3 formants amplitudes are manipulated; values here indicate the percentage of the non-F3 formants present in the stimuli. The portion of the axis marked “Series” refers to those stimuli where non-F3 formants are fully present but the difference between low and high F3 onset frequencies has been reduced; values here indicate the difference (in Hz) between the onset frequencies.

