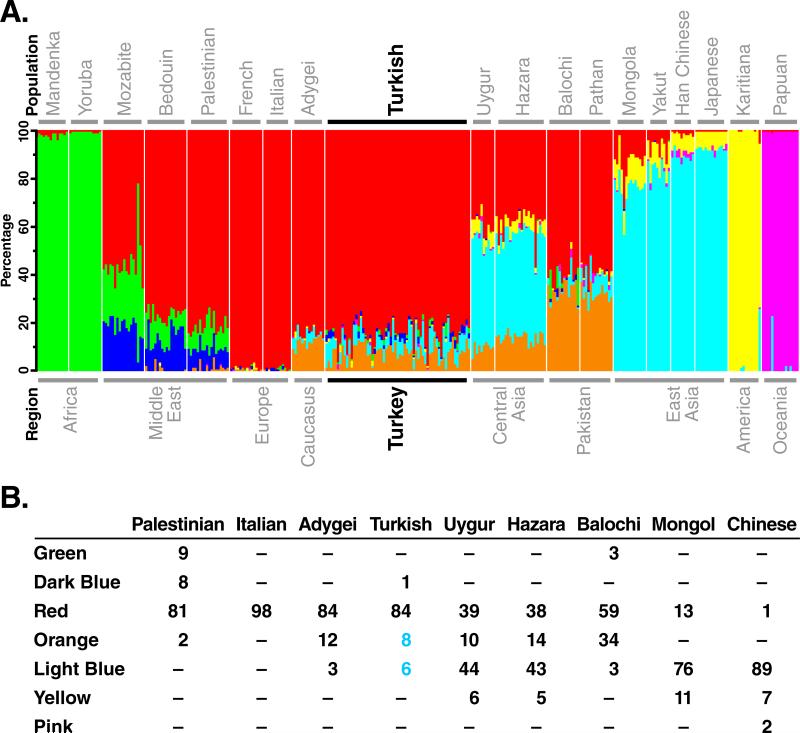
Figure 3.
STRUCTURE analysis of global dataset with 6,858 SNP markers genotyped in 323 subjects. (A) Representative populations from each geographic region were selected from HGDP data (Li et al., 2008), and Turkish samples were included in the analysis. Populations are labeled above the figure, with their geographic affiliations below. Each individual is represented by a thin vertical line, which is partitioned into K colored segments (K = 7). Colors represent the inferred ancestry from parental populations. White lines separate individuals of different populations. Seven other STRUCTURE runs produced very similar individual ancestry estimates. (B) The average ancestry estimates for selected populations are shown for comparison.

