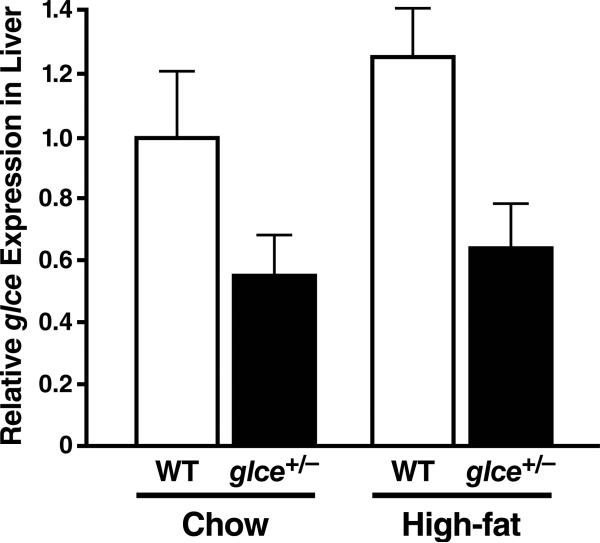
Figure 5.
Glce expression in mouse liver. Quantitative PCR was performed with cDNA. Results were analyzed with the delta-delta Ct method. Data were normalized to expression in the wildtype (WT) liver, and gusb expression was used for internal normalization. Values are mean ± SD (n = 4 per group) of triplicate measurements and two different experiments.

