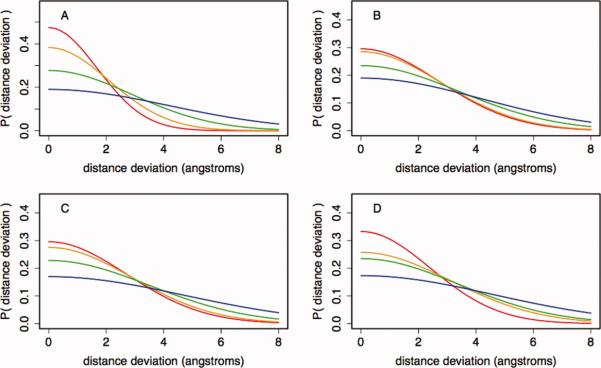
Figure 1.
Dependence of distance deviations on individual features. Conditional probability distributions were calculated using the features and approach outlined in Methods section, which follows the Modeller approach for deriving distance restraints.3 Each panel shows the distribution of distance deviations conditioned on a single feature (A—global sequence similarity, B—local sequence similarity, C—burial in the template structure, and D—distance from an alignment gap). Lines represent the distribution of deviations for quantiles of the feature (red, 0–25%; orange, 26–50%; green, 51–75%; blue, 76–100%). Boundaries that define quantiles for each variable are listed in Supporting Information Table SI.

