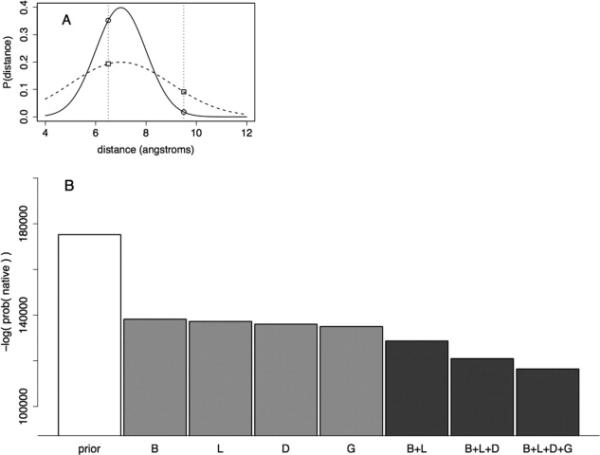
Figure 2.

Model evaluation based on likelihood of independent test set. A: Illustration of model evaluation with distance predictions based on two Gaussians. Both Gaussians have a mean of 7.0 Å and a standard deviation of 1.0 (solid line) or 2.0 Å (dashed line). If the native distance occurs at 6.5 Å, the sharper Gaussian (solid line) is a better model. If the native distance occurs at 9.5 Å, the wider Gaussian (dashed line) is a better model. B: Different models were assessed based on the likelihood of distances from an independent set of aligned proteins. Each bar shows the likelihood of sampling a set of atom-pair distances using a fixed set of alignments and different variables to construct the models. The letters below each bar list the input features used to construct the model (B—burial in template structure, L—local sequence similarity, D— distance from a gap, and G—global sequence similarity). The prior model is a Gaussian model based only on sequence separation of the residues in the linear sequence (see Methods section) and is shown here as a negative control. The middle four bars show the performance of models based on single features, while the final three bars represent models based on two, three, and four features. All four single-variable models out-perform the prior model. Adding predictors to each model improve the likelihood of sampling the native atom-pair distance, which supports the use of all four variables in estimating deviations from template structures.
