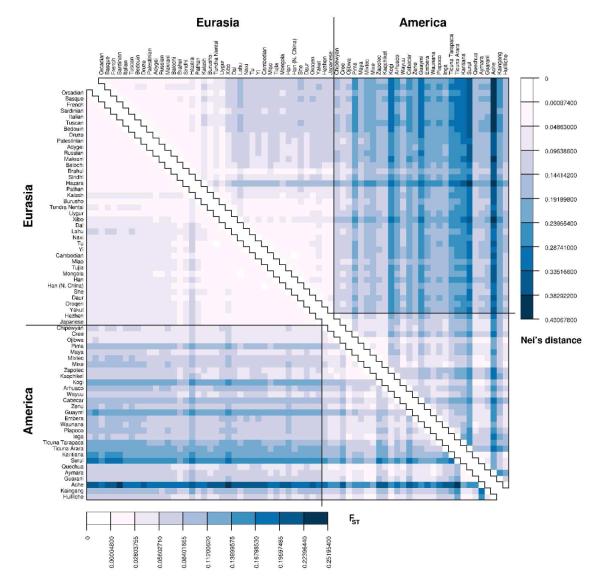
Fig. 3.
Heat map of pairwise genetic distances between all 68 populations based on 678 microsatellite loci. The lower triangle depicts FST (Reynolds et al., 1983); the upper triangle represents Nei’s standard genetic distance (Nei, 1978). Populations are ordered according to longitude in Eurasia (from west to east) and according to latitude in America (from north to south). Colors were chosen to represent equal-sized intervals of genetic distance, based on the range of non-negative genetic distances observed using each estimator; numerical scales for the colors in each triangular matrix are given below the FST matrix, and to the right of the Nei’s distance matrix. Diagonal elements in each matrix are zero and are indicated by white squares. The two triangles can be fit together by superposing their diagonals. Genetic distances estimated to be negative are set to zero, and they are also depicted as white squares.

