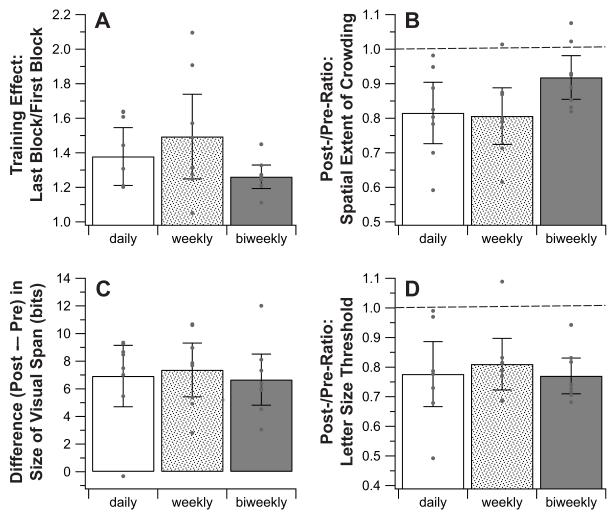
Figure 4.
Improvements in accuracy of identifying crowded letters during training (A) and the associated improvements in the spatial extent of crowding (B), the size of the visual-span profile (C) and letter-size threshold (D) are compared for the three training groups (daily, weekly and biweekly). Values plotted are averages across observers in each group. Error bars represent ±95% confidence intervals. Small gray dots represent values for individual observers. For (A), values plotted represent the ratio in performance accuracies between the last and the first block of trials. For (B) spatial extent of crowding and (D) letter-size threshold, post-/ pre-ratios smaller than 1 (dashed lines) represent improvements.

