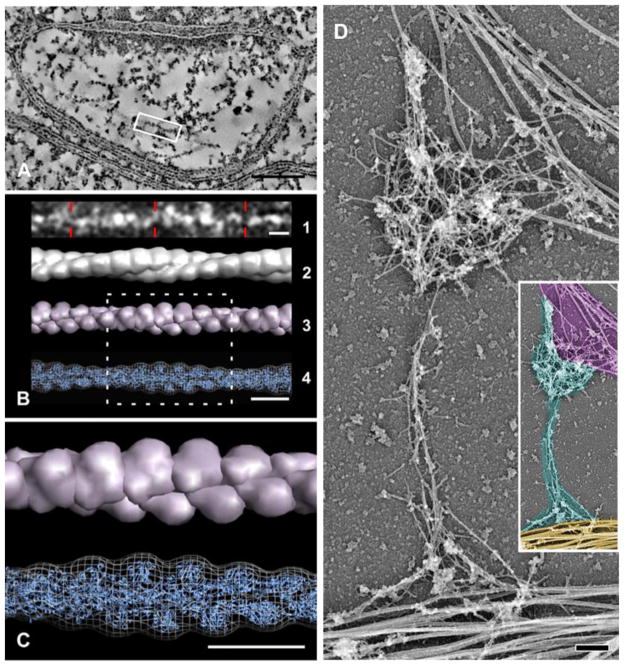
Figure 2. Appearance of F-actin in spines, demonstrated by high-resolution EM techniques.
Left panel shows electron tomography of a thin section from rat neocortex (images adapted with permission from [81]); right panel is from a platinum-shadowed replica of cultured hippocampal neurons ((image adapted with permission from [80]). A shows a virtual slice (~4 nm thick) through a spine (the PSD is at top). A volume containing a long, straight filament (highlighted by the white box) is shown in B1 (image inverted to highlight features). This filament displays helical periodicity corresponding closely to that predicted for F-actin. B2 shows a helically-averaged surface representation of the extracted density. B3 is a low-resolution representation of an atomic model of a canonical actin filament obtained from high-resolution electron microscopy analysis. B4 shows the fit of this atomic model (blue cartoon representation) into the symmetrized, extracted filament density (chicken wire representation). C is an enlargement of the boxed region in B. Scale bars: 100 nm for A, 10nm for B and C. D illustrates the cytoskeleton of a spine after membranes have been removed. The organization of filaments in the head and neck of a mushroom-shaped spine associated with dendrite (yellow pseudocolor, at bottom of inset) and with axon running along the head (magenta, top of inset) from 14 DIV neurons, treated with Triton X-100 to reveal internal features. Thick fibers in dendritic shaft represent microtubules. Actin filaments (cyan pseudocolor in inset) are the main cytoskeletal elements in the spine head and neck. Inset in D is a shrunk and pseudocolored version of panel D. Scale bar 200 nm.

