
Figure 5.
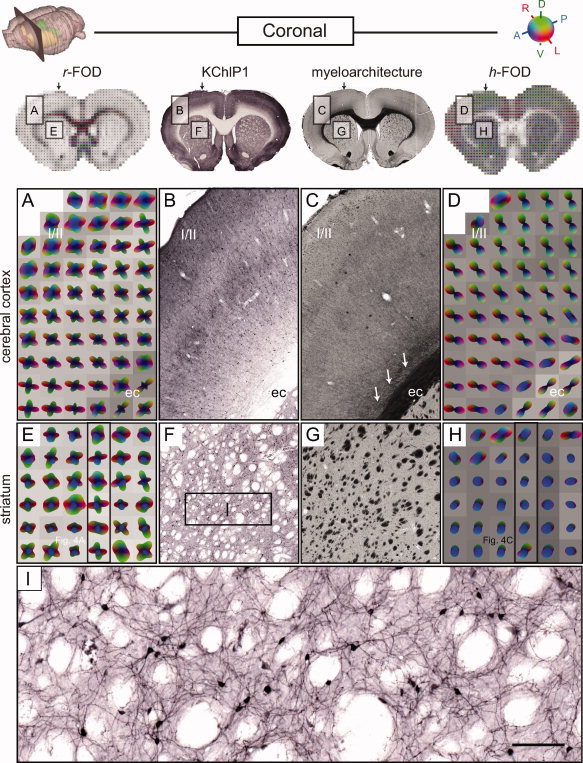
Coronal comparison of RSI and histology in the cerebral cortex and striatum. Presentation as in Figure 4. In addition to the myelin stained histological sections (middle column; C, G) from the same specimen, potassium channel (KChlP1) stains (middle column; B, F, I) are also included from a similar specimen (from http://www.brainmaps.org; see Sample Preparation and Image Acquisition section). Two regions are compared, one in the parietal cortex (A–D) and one in the dorsolateral striatum (E–I). Arrows on top of the inset images and frames in E and H indicate the position of the sagittal slices shown in Figure 4A,C, respectively. In the cortex, the primary orientation of the r‐FOD and h‐FOD are aligned radial to the cortical surface, while the r‐FOD displays additional tangential orientations, which are most prominent in superficial layers I/II. In the striatum, the through‐plane (anterioposterior, blue) r‐FOD and h‐FOD orientations reflect the cross‐sectioned myelin stained fibers passing through the striatum (dark dots in E, light dots in F). Here, again the r‐FOD displays substantial additional in‐plane structure (red and green peaks), which we argue reflects the complex geometry of corticostriatal terminal plexuses (Fig. 6D) and vast networks of dendritic arbors in the region (I). Scale bar 50 μm.