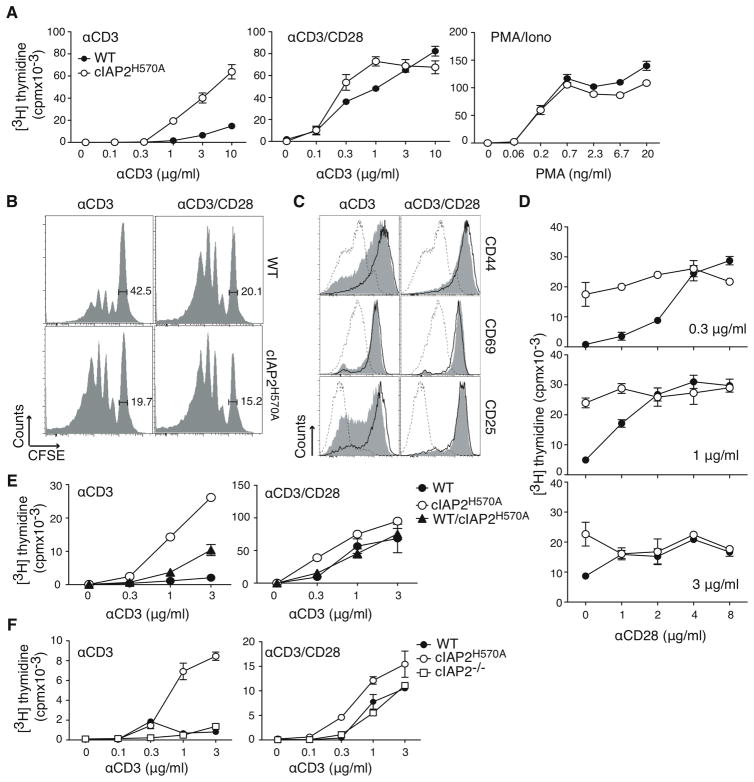
Figure 2. c-IAP2H570A are costimulation-independent.
(A, D, E, and F) Purified T cells were cultured with the indicated stimuli for 48 hr, pulsed with [3H]-thymidine, and harvested 18 hr later. Anti-CD28 was coated at 2 μg/ml, except for panel D, were a titration was done. PMA was used at the indicated concentrations and ionomycin was used at 500ng/ml. (B) CFSE-labeled T cells were stimulated with anti-CD3 (3 μg/ml) in the presence or absence of anti-CD28 (2μg/ml), and CFSE dilution was monitored after 3 days. (C) The expression of activation markers was monitored on WT (gray filled histogram) and c-IAP2H570A (open histogram) purified T cells after 3 days of stimulation as indicated. The dotted line represents the expression profile of unstimulated WT cells. The results showed in this figure are representative of, respectively: (A) more than five; (B), (C), and (E) three; (D) and (F) two independent experiments.

