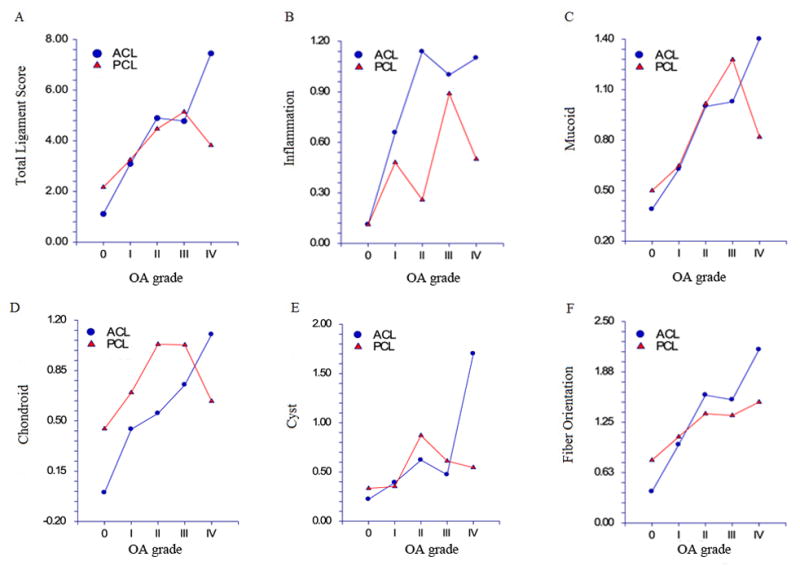
Figure 2.

Total and specific PCL and ACL scores versus cartilage grade. Valuess depicted are the mean ligament scores at each specific cartilage grade, separately for PCL and ACL. Total PCL and ACL histological score (A), inflammation (B), mucoid changes (C), chondroid changes (D), cystic changes (E) and fiber orientation (F). Mean total and component ACL and PCL scores tended to increase with increasing OA grade: total scores, F4,111 = 11.42, p<0.001; inflammation, F4,111 = 2.63, p=0.038; mucoid, F4,111 = 4.34, p=0.027; chondroid, F4,111 = 2.54, p=0.044; cystic changes, F4,111 = 4.36, p=0.0026; fiber orientation, F4,111 = 11.10, p<0.001.
