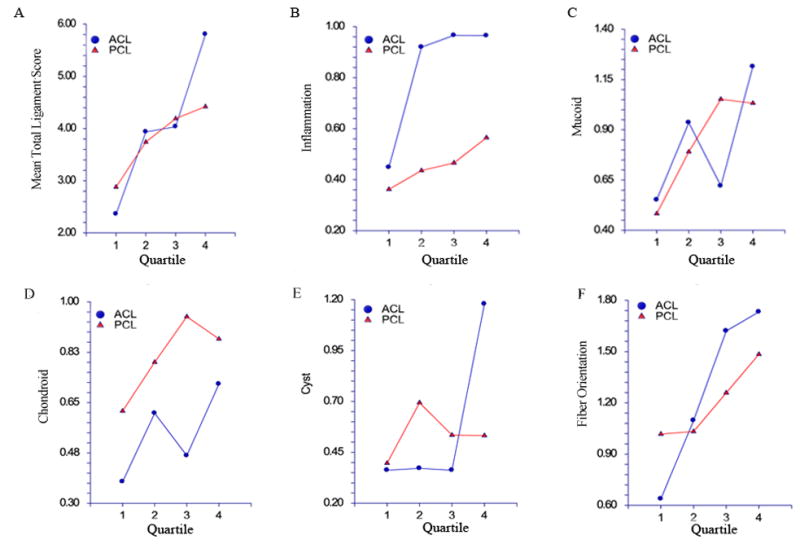
Figure 3.

Total and specific PCL and ACL scores versus age. Ages were divided into 4 quartiles; within each quartile, means and associated 95% confidence intervals of total and specific histological scores are shown, separately for PCL (red) and ACL (blue). Total PCL and ACL histological score (A), inflammation (B), mucoid changes (C), chondroid changes (D), cystic changes (E) and fiber orientation (F). In paired analyses, ACL inflammation scores were found to be significantly higher than the corresponding PCL scores (t116 = 3.63, p<0.001), and PCL chondroid metaplasia scores were significantly greater than their ACL counterparts (t115 = −2.71, p=0.009). No significant pairwise differences between ACL and PCL scores were found with inflammation, mucoid degeneration, fiber organization, or total scores.
