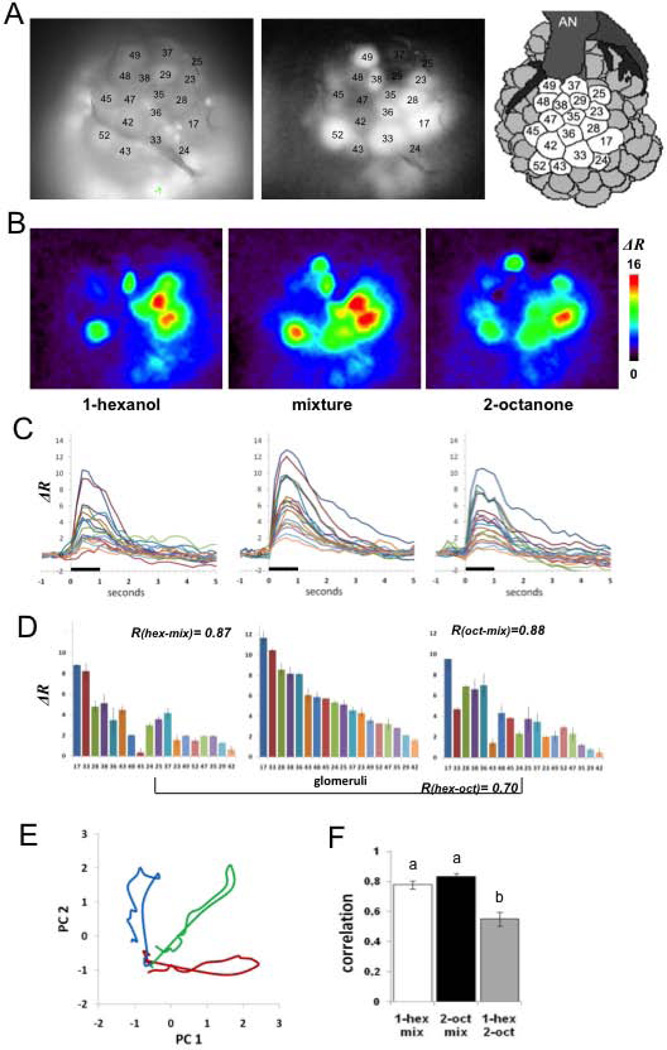
Figure 1.
Calcium imaging of projection neurons in the honey bee antennal lobe. A, View of the antennal lobe after staining the PNs. The picture shows the dorsal surface including 18 identified glomeruli (Galizia et al., 1999) used for the imaging analyses. Left: basal fluorescence images obtained with 380nM excitation light and LP510 emission filter, allow identification of glomeruli according to size, shape and position by comparison with the published honey bee AL atlas (Galizia et al., 1999; Flanagan and Mercer 1989). Basal fluorescence images are also used for verification of homogeneous staining in all glomeruli used for analysis. Middle panel: Correlation images (see methods) clearly define boundaries between glomeruli and thus were used as an additional tool to verify glomeruli identification. Darker glomeruli do not indicate lack of staining (controlled for from the images such as the one in the left panel); these glomeruli were not activated by the odors and consequently produce a low correlation values between neighboring pixels). Right panel: Schema of the dorsal surface on the honey bee AL showing 18 glomeruli used in our analyses (AN: antennal nerve). B, Color-coded (see scale) changes in calcium levels averaged between 400 and 800 ms after odor onset. The figures show distinct but slightly overlapping spatial activity patterns for each of the three odors. C, Glomerular activity over time to show spatio-temporal activity patterns. The same line color across figures represents the change in ratio over 6 s (1 s before stimulation through 5 s after) in a single identified glomerulus for each of the three odors. D, Calcium responses for each of the 18 glomeruli averaged over 1s of stimulation ordered from the highest response to the lowest for the mixture (middle figure). The same ordering was maintained for 1-hexanol (left) and 2-octanone (right) to emphasize changes in activity in each glomerulus for each of the odors compared to the mixture. Error bars represent Standard Deviation of two measurements. R-values inserted in the Fig. 1D refer to the Pearson correlation coefficients used to compare pairs of odor patterns within animal and within session. E, Principal Components Analysis (see Methods) used to show the evolution of the activity patterns over 200 ms time steps during odor stimulation in one animal (Galan et al., 2006; Fernandez et al., 2009) for 1-hexanol (blue), the mixture (green) and 2-octanone (red). With the onset of odor stimulation the transients for the pure odors project along each PC axis and reach maximal separation between 400 and 600 ms (Fernandez et al., 2009). After odor termination the transients loop back and return to origin. F, Mean +/− SE of the correlation coefficients indicated in D, for 17 animals prior to any treatment. The correlations between the pure components and the mixture are significantly higher than the correlation between the pure odorants; different letters on tops of the bars indicate significant differences at p<0.01.

