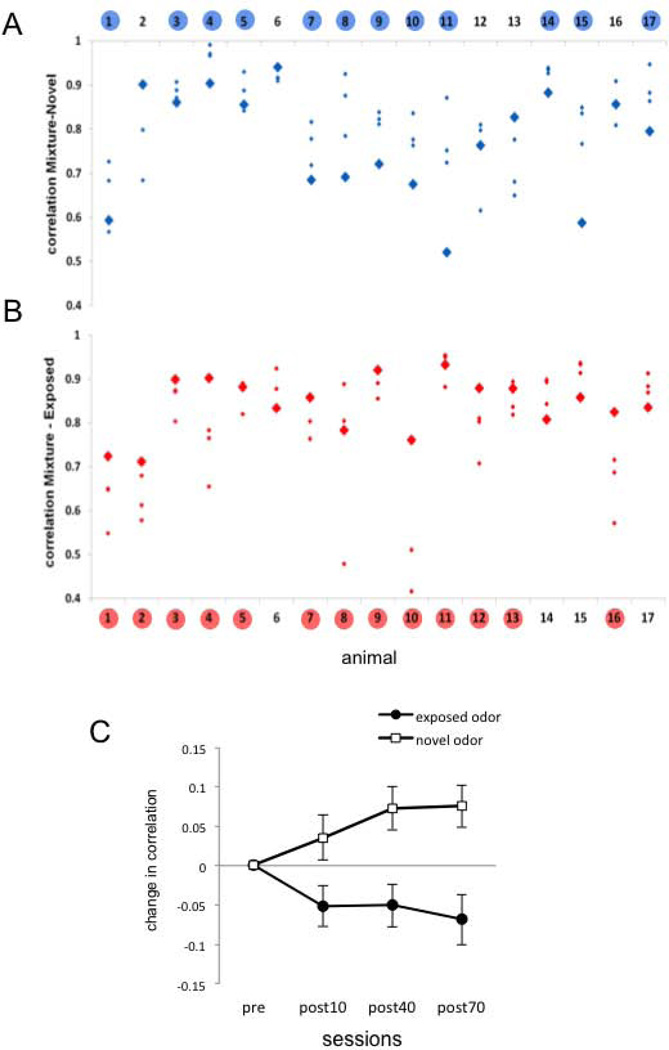
Figure 3.
Correlation coefficients between the mixture and the pure odors before and after exposure. A. Absolute Pearson correlation coefficients between the activity patterns elicited by the novel odor (odor not used during exposure) and the mixture for each individual bee (n=17). Bold blue diamonds correspond to the correlation value before exposure. Small diamonds correspond to the correlation values after exposure. Numbers highlighted in blue indicate bees in which the average of the correlation from the three post-exposure sessions is higher than the correlation in the initial session. B. Absolute Pearson correlation coefficients between the exposed odor and the mixture for each individual bee. Bold red diamonds correspond to the measurement performed before exposure and small diamonds to the measurements performed after exposure. Numbers highlighted in red indicate bees in which the average of the correlation values obtained in the three post-exposure sessions is lower than the correlation in the initial session. Statistical analysis was strictly based on raw correlation values as they are shown in figures A and B. Two factors repeated measures ANOVA; factor 1 “novel or exposed” odor, NS; factor 2 (repeated measurement) “sessions”, NS; Interaction p =0.001. C. The data from figures A and B plotted as the net change of the correlation along the experiment. The figure shows the average and SEM of the difference between each post-exposure session and the session before exposure (n=17). The change in correlation was calculated within each bee by subtracting the correlation value obtained in the first test session from the values obtained in the post-exposure sessions.

