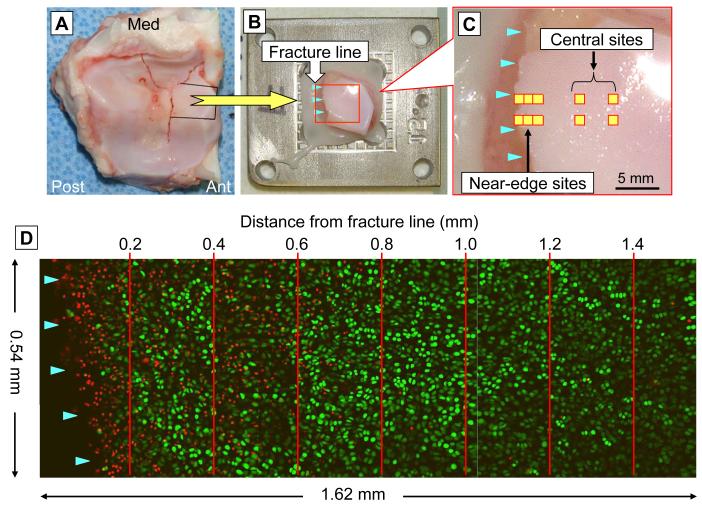
Figure 2.
Chondrocyte viability analysis. (A) Specimen sampling from the fractured distal tibial surface. (B) An osteoarticular sample mounted on the specimen holder. (C) Scanning site selection for the time course analysis. (D) Live/dead cell counting in the superficial zone (within 100 to 150 microns of the articular surface), in 0.2-millimeter intervals in a region neighboring a fracture line.

